Overview
The Available Over Time view in the SKU page helps diagnose inventory changes throughout the day. This tool shows how Available, On Hand, Pending, and Incoming quantities change over time for a specific SKU and warehouse.
This view is especially helpful when investigating questions like:
- Why inventory availability suddenly changed
- Why an order was pushed or delayed overnight
- What happened to inventory at a specific time
The chart and log allow detailed inspection of inventory levels and system events across a selected time range.
Where to Find This View
- Navigate to Inventory → SKUs in Luminous.
- Open the SKU that needs investigation.
- Click the Qty Logs tab.
- Select Available over time.
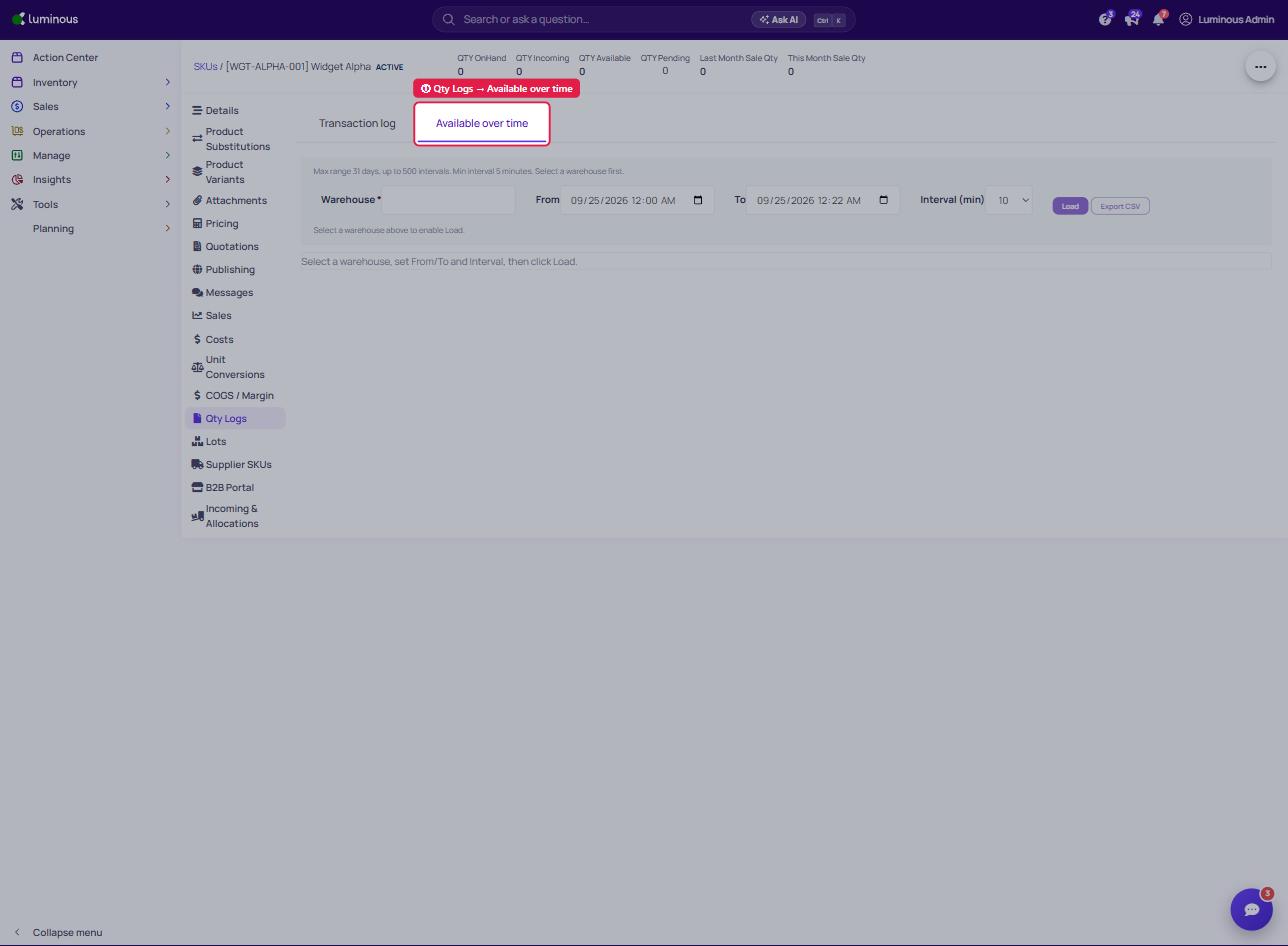
How to Use the Available Over Time View
- Select a Warehouse
Choose the warehouse where inventory activity should be analyzed. - Choose a Time Range
Set the From and To timestamps for the investigation window. - Set the Interval
Choose the time interval (for example: 10 minutes, 30 minutes).
Shorter intervals provide more detailed tracking. - Click Load to generate the chart and data.
Understanding the Chart
The chart visualizes inventory levels across time. Each line represents a different quantity type:
- Available – Inventory that can be allocated to new orders.
- On Hand – Physical inventory currently in the warehouse.
- Pending – Inventory reserved for orders that have not shipped yet.
- Incoming – Inventory expected from purchase orders or transfers.
Changes in the lines indicate when inventory events occurred.
Example uses:
- Identify when Pending quantity spikes due to order allocation.
- Detect when Available drops due to reservations.
- Verify if Incoming inventory was added during a specific window.
Reviewing the Detailed Log
Below the chart is a time-based log of inventory snapshots.
The table shows:
- Time
- Warehouse
- SKU
- On Hand
- Pending
- Incoming
- Available
- Changes
If inventory changed during a time interval, the Available Changes column shows the number of events recorded.
Selecting the change entry allows deeper inspection into what triggered the inventory update.
Tips for Investigating Inventory Issues
- Start with a larger time window, then narrow down to a smaller range once the change is identified.
- Use shorter intervals (5–10 minutes) for more precise event tracking.
- Compare Available vs Pending when diagnosing order pushes.
- Check the Changes column to quickly find moments when inventory updates occurred.
Common Use Case
Example:
A merchant notices that an order was pushed at 2:00 AM.
Using the Available over time view, the merchant can:
- Load data from midnight to 4:00 AM.
- Identify the exact time when Available quantity dropped.
- Check the Changes log to determine what caused the shift (order allocation, cancellation, or inventory adjustment).