Overview
The Accounting Performance Dashboard provides a complete view of financial performance and data accuracy for a selected period. It helps accountants and managers review revenue, cost of goods sold (COGS), inventory value, and identify any issues that may impact month-end close.
This dashboard is designed to answer two key questions:
- What happened this month financially?
- Can these numbers be trusted for closing the books?
Who this is for
- Accountants responsible for month-end close
- Owners and managers reviewing business performance
Access the Accounting Performance Dashboard
- Go to Insights > Accounting
- Select Close the Books
- Choose the period with This month, Last month, or Custom (the Close through month)
Review Month-End Summary
The top banner provides a quick snapshot of close readiness:
- Date Range – Selected reporting period
- Close Status – Ready, Not Ready, or Ready with Warnings
- Sales Orders Missing COGS – Orders that may impact accuracy
- Large Variances – Detected inconsistencies in financial data
- Last Updated – Most recent data sync
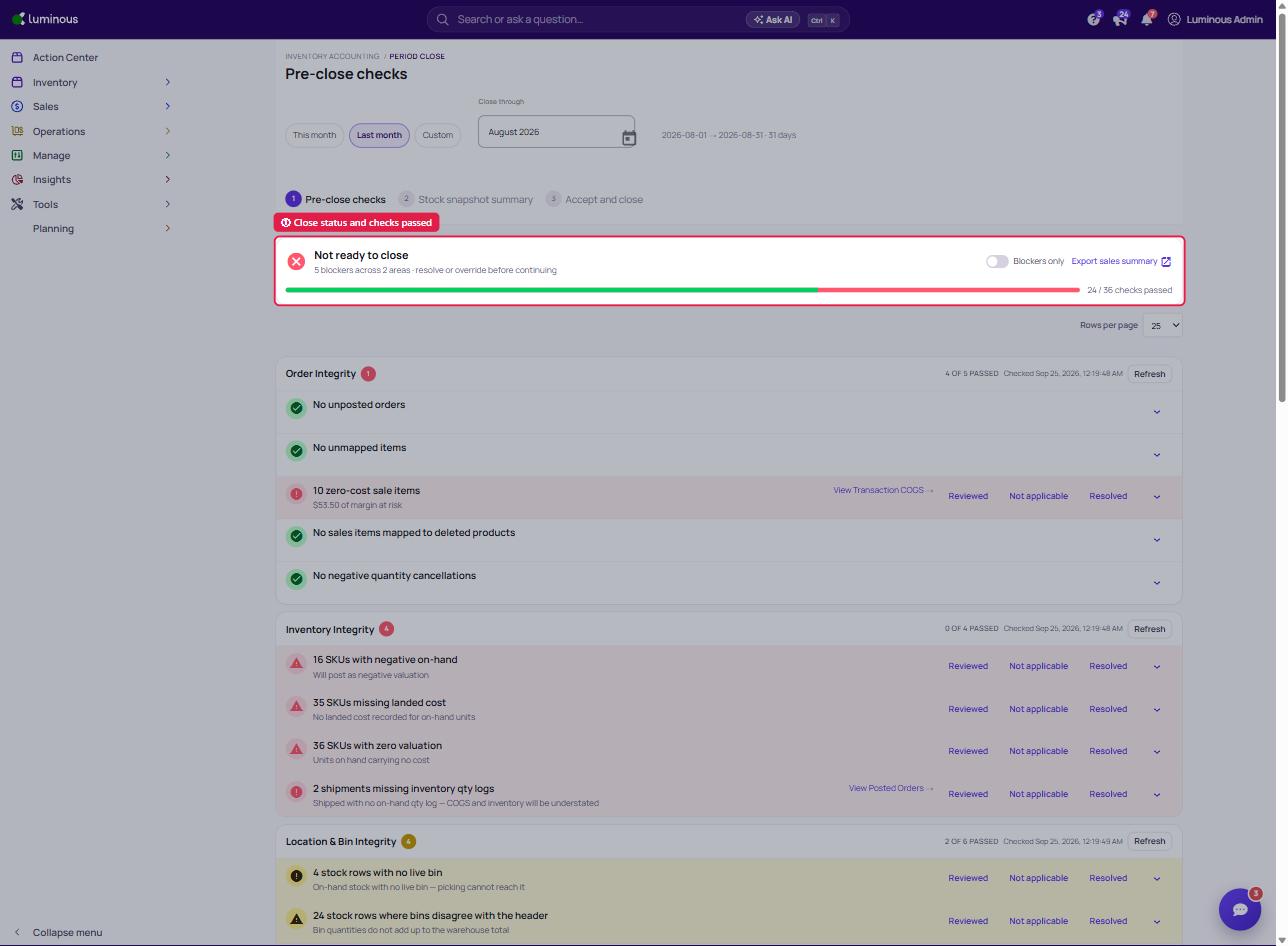
Use this section to quickly assess whether the books are ready to close.
Understanding Status Indicators
- Green checkmark – Check has passed
- Red warning / BLOCKING – Issue must be resolved before closing
- Progress indicator (e.g., 18/20 checks passed) – Shows overall readiness
If any section shows “Not Ready to Close”, at least one blocking issue remains.
Analyze Financial Performance
The Financial Snapshot highlights key metrics:
- Total Revenue
- Total COGS (with link to detailed report)
- Gross Profit
- Gross Margin %
Additional metrics may include:
- Returns and refunds
- Discounts applied
- Ending inventory value
- Inventory turnover
These metrics help evaluate profitability and overall performance.
Review Sales & Channel Performance
Understand how sales are distributed across channels:
Key metrics:
- Total Net Revenue
- Sales Count
- Units Sold
- Average Order Value (AOV)
Sales by Channel:
- Shopify
- Amazon
- B2B / Wholesale
Each channel includes revenue, order volume, units sold, and AOV to compare performance.
Evaluate Returns, Refunds, and Discounts
This section highlights factors that impact margins:
- Returns (count and percentage)
- Returned COGS
- Refunds (value and percentage)
- Discounts Given
Use this data to understand revenue adjustments and margin changes.
Review Inventory & Fulfillment
Monitor inventory value and operational performance:
Inventory Metrics:
- Ending Inventory Value
- SKUs in Stock
- Units in Stock
- Inventory Turnover
- Deadstock Value
Inventory Reconciliation:
- Starting Value
- COGS
- Receipts
- Adjustments
- Ending Value
This ensures inventory balances match financial records.
Fulfillment Metrics:
- Orders Received vs. Shipped
- Unfulfilled Orders
- Average Shipping Cost (if available)
- Average Fulfillment Time
Identify Data Issues & Close Readiness
The dashboard highlights issues that may affect reporting accuracy:
- Missing or incomplete data (e.g., orders without COGS)
- Inventory discrepancies
- Large financial variances
Each issue includes a link to investigate and resolve it.
Order Integrity
Validates that all sales order data is complete and accurate:
- No unposted orders
- No unmapped items
- No zero-cost sale items
- No negative quantity cancellations
How to fix the identified issues (highlighted in RED) in Order Integrity
- Click the field highlighted in red to view all SKUs that require correction.
Note: There should be either Estimated Landed cost or Cost Layer associated in your SKU to fix this error.
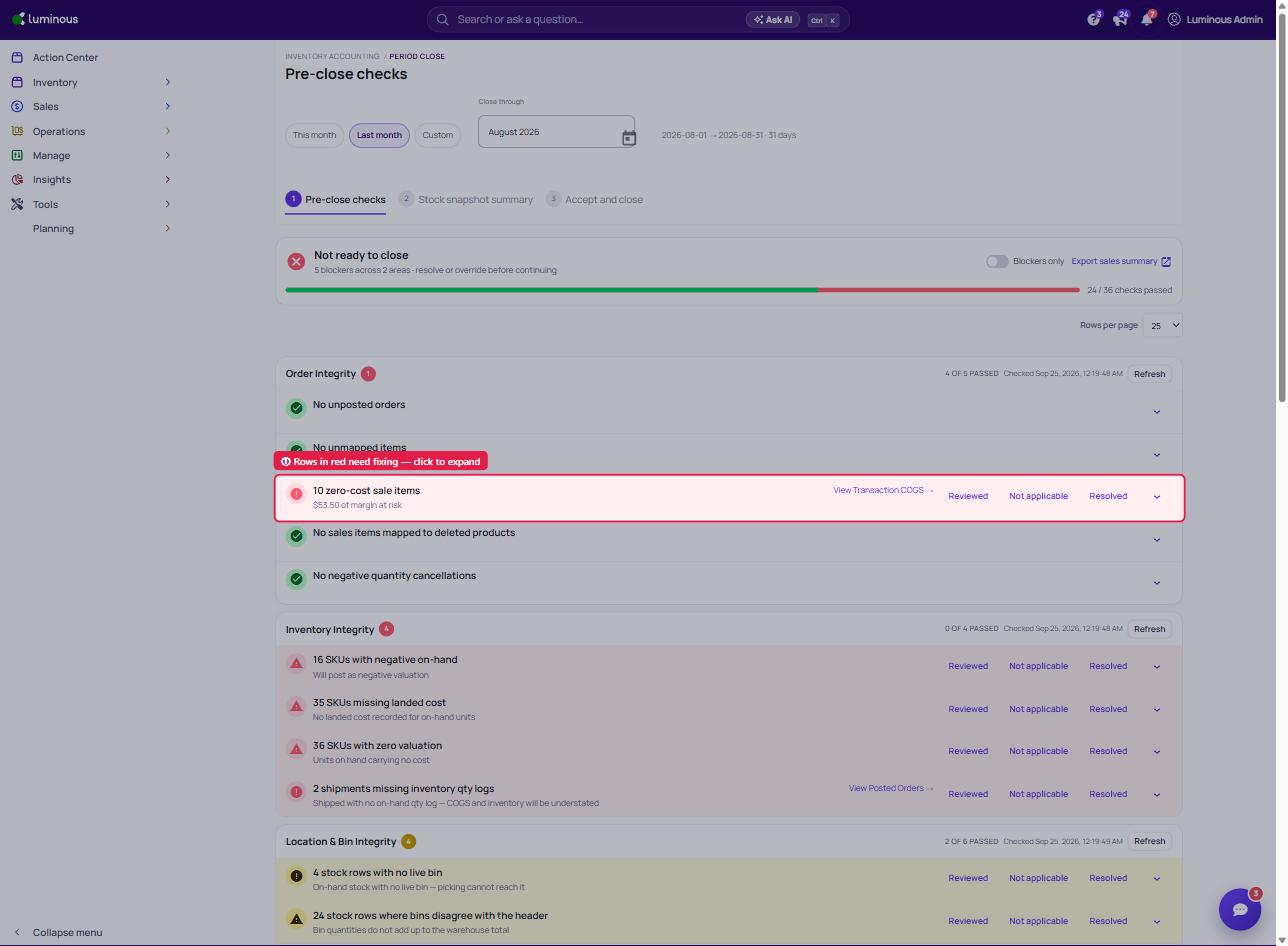
-
Select SKUs to Fix
- Tick the checkbox beside the SKUs to select SKU or tick multiple checkboxes to fix multiple SKU at once
-
Choose a Fix Method
There are two available options:Option 1: Use ELC (Estimated Landed Cost)
- Refer to the Suggested ELC column
- Refer to the displayed value to update the SKU
Option 2: Use cost layer (Recommended)
- Refer to the Suggested Cost Layer column
- Refer to the indicated amount to correct the SKU
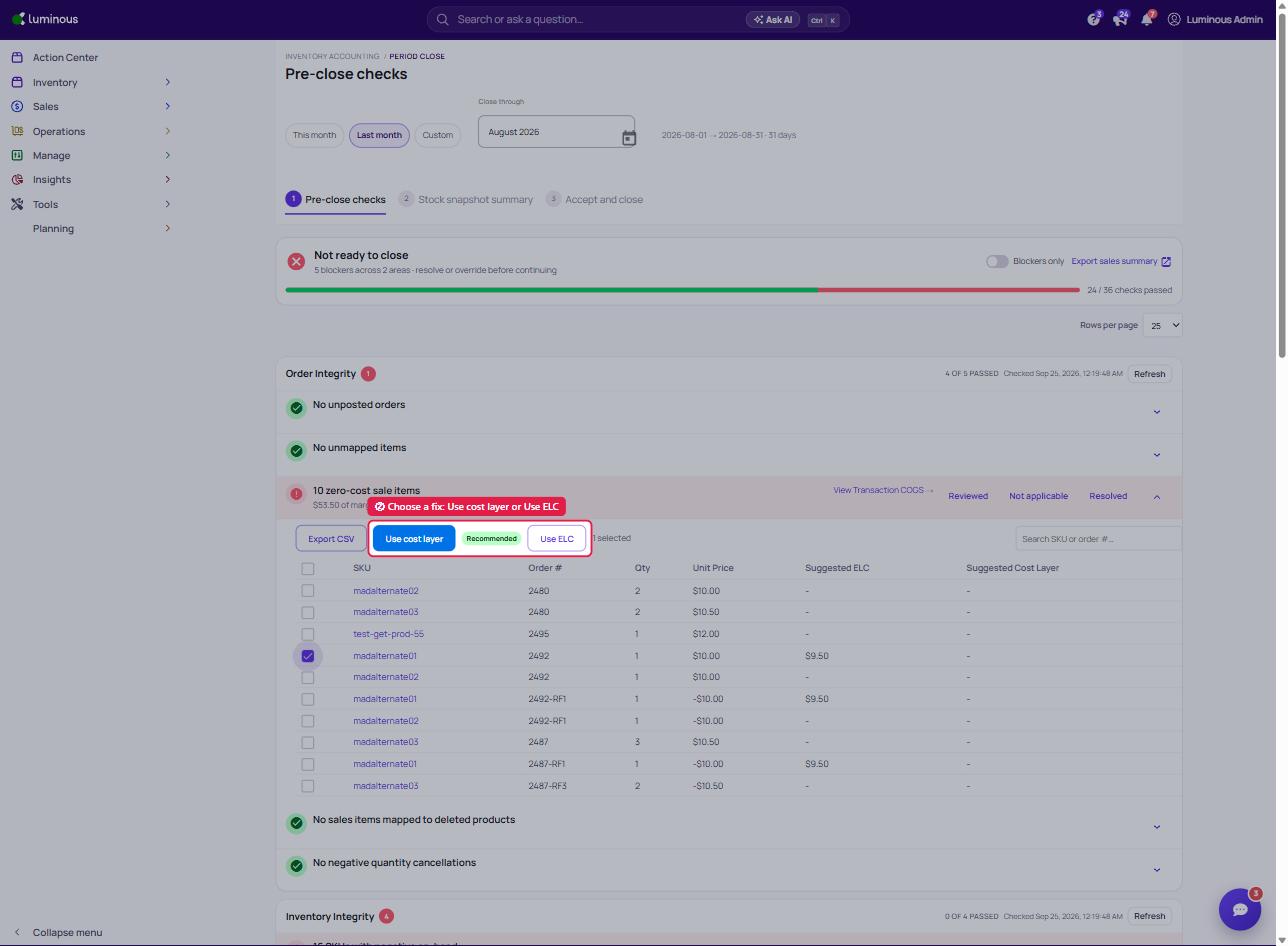
- Once you select the fix method, a pop up window will appear to confirm your action.
Inventory Integrity
Ensures inventory data is accurate:
- No negative on-hand inventory
- All SKUs have valid inventory valuation
How to fix Inventory Integrity Accuracy
Option 1: Fix Inventory Per SKU
- Navigate to the SKU with an error
- Click the SKU to open the SKU Details Page
- Click Edit
- Locate the Estimated Landed Cost (ELC) field
- Enter the correct value
- Click Save
Repeat this process for each affected SKU.
Option 2: Bulk Fix via Export & Import
Step 1: Export Products with Errors
- Go to the Close the Books page
- Click Export CSV
- Download the file containing all SKUs with errors
Step 2: Update the File
- Open the file in Excel
- Locate the Estimated Landed Cost column
- Enter the correct values for each SKU
- Save the file as .xlsx
Step 3: Import Updated File
- Return to the Close the Books page
- Ensure that you indicate the date rage before importing a file or your import will fail
-
Apply SKU Costs to Period:
- Each row maps a SKU to a unit cost
- All sales items with that SKU and order date in the range will be updated
- Cost = quantity × unit cost per line
- Both from_date and to_date are required
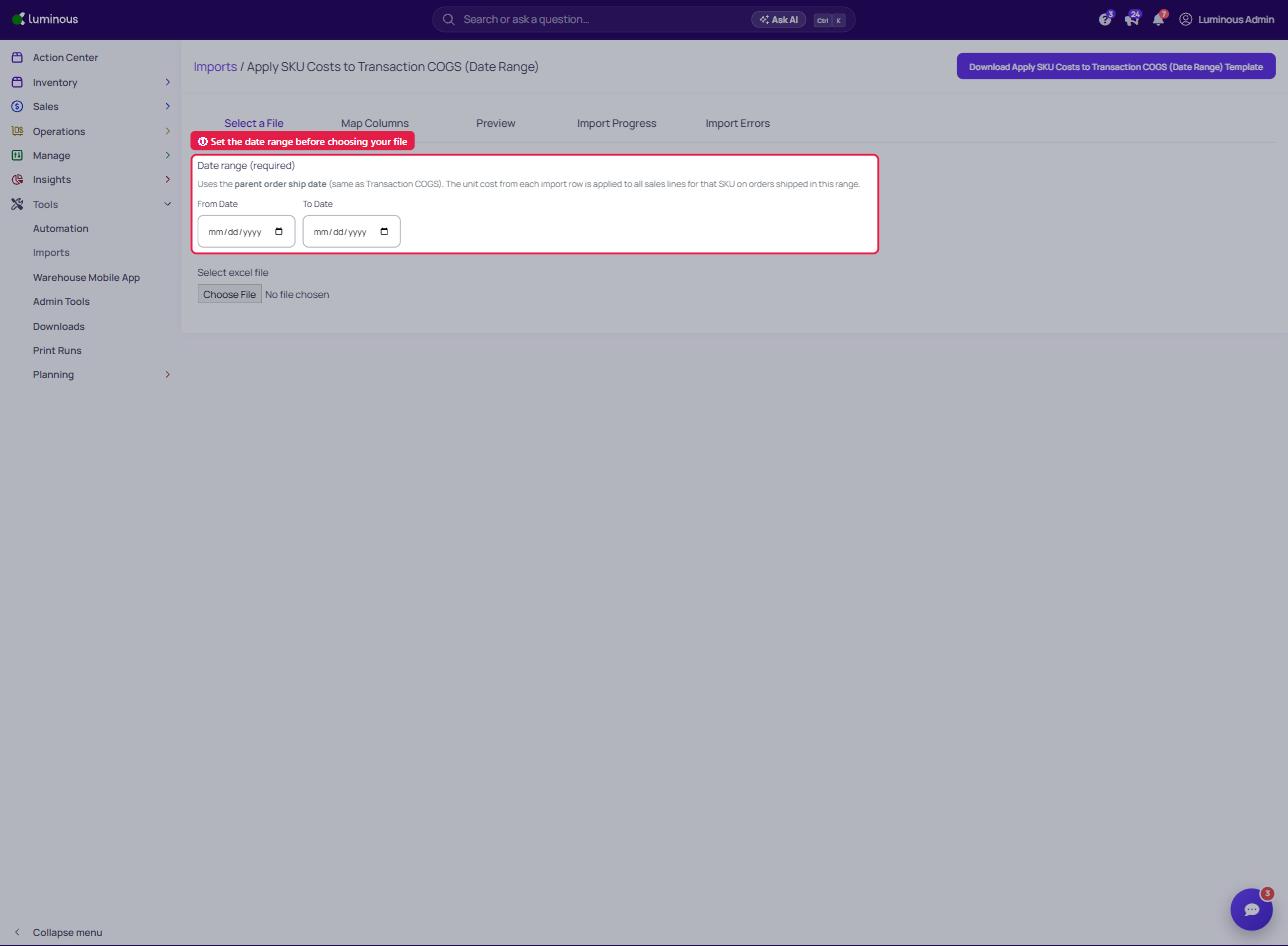
-
- Click Import Costs (under the SKUs with zero valuation check)
- Upload the updated .xlsx file
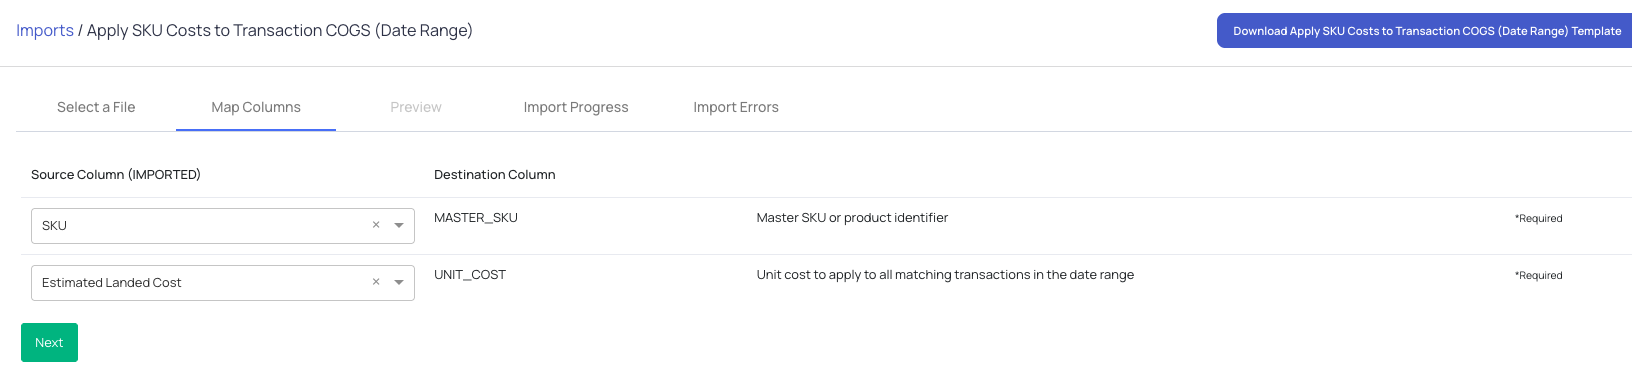
Step 4: Map Fields
-
Map the following fields:
- SKU → Master SKU
- Estimated Landed Cost → Unit Cost
-
Click Next
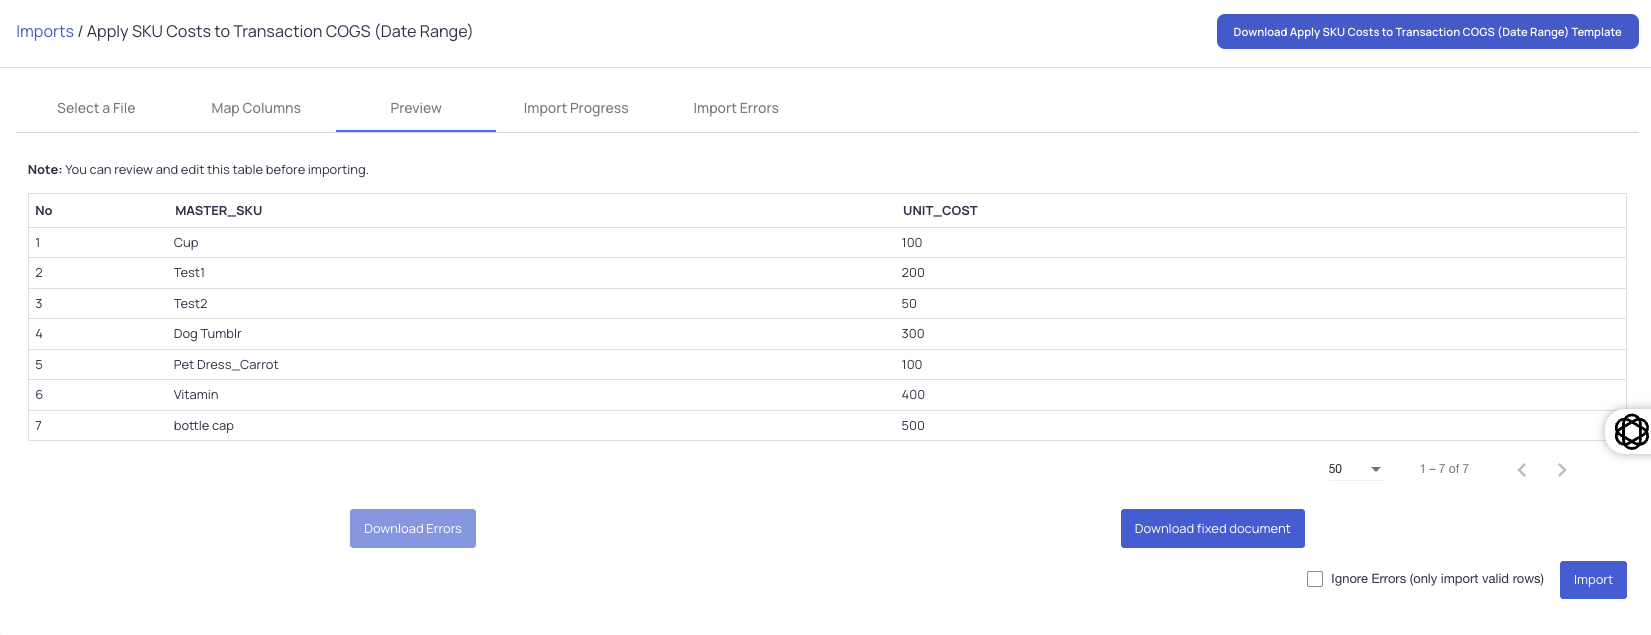
Step 5: Review and Import
- Review for any errors
- Make corrections if needed
- Click Import to finalize
Accounts Payable
Confirms vendor-related financial data is complete:
- No unposted bills
- No open bill variances
- All posted bills reconciled
- No bills on hold
- No uninvoiced receipts (GR/IR)
- No unapplied vendor credits or prepayments
- No QuickBooks sync errors
Sync & Integration Health
- All channels syncing
- No invoice sync errors
- No failed webhooks
Invoice & Shipment Integrity
- No partially invoiced shipped orders
- No over-invoiced orders
- No over-shipped orders
Tips & Best Practices
- Review this dashboard before closing the books each month
- Resolve all blocking issues before finalizing financials
- Use drill-down links to validate key numbers
- Pay close attention to missing COGS and inventory discrepancies
FAQs
Q: Why are my COGS incomplete?
A: Some sales orders may be missing cost data. Use the provided link to review and update affected orders.
Q: Can the dashboard be used for forecasting?
A: No. This dashboard is designed for financial review and close, not inventory planning or forecasting.
Q: Why don’t my numbers match external reports?
A: Check for missing data, sync delays, or unposted transactions that may impact totals.
Q: Upon import, it says there are no order on that date range for that SKU. What should I do?
A: Click the the download button, it will only download what is missing or SKU that has an error. Go back to the "Select a file" step and change the date range.
Need help?
Contact the support team for further assistance.